

Claude data analysis is most useful when you define the question before asking for a chart. A clean table and a clear metric matter more than a visually impressive report. This guide explains a practical workflow for exploring a small project dataset, validating calculations, and writing findings that reflect the actual evidence rather than unsupported causal claims.
What this workflow helps you do
This is a practical, evergreen workflow for claude data analysis. Start with a small example and move to real work only after the result meets your requirements. The examples are hypothetical teaching scenarios, not claims about measured customer outcomes. Interfaces, account capabilities, and policies can change; use the official resources below to check current product details.
Worked example
Imagine a table of completed website projects with start date, delivery date, revision count, and project type. You want to understand delivery time. First define whether elapsed calendar days or working days are relevant, and how incomplete projects should be handled. Ask Claude to help inspect the data and propose a summary, then calculate a few rows independently. A longer average duration for one project type does not prove that the type caused delays; differences in scope or client response time may explain the pattern. Keep that uncertainty visible in the report.
Important principles
Analysis has separate layers: definitions, cleaning, calculation, visualization, and interpretation. An error in the first layer can make every later result misleading even when the arithmetic is correct. Record exclusions and missing values instead of silently replacing them. Use reproducible calculations in a spreadsheet or script when the task requires numerical reliability. Ask for labels that make charts understandable without the surrounding conversation, including units and the population represented.
Step-by-step workflow
- Write the analytical question and define its metric. Identify the population, date range, units, and whether incomplete records belong in the calculation or a separate category.
- Inspect the table for duplicates, missing values, inconsistent labels, and impossible dates. Document cleaning decisions so another reviewer can understand how the analysis dataset differs from the source.
- Calculate a small sample independently before summarizing everything. Check duration calculations, denominators, and group definitions, then compare the verified sample with the proposed analysis method.
- Choose a chart suited to the comparison. Show units and meaningful categories, avoid distorted axes, and explain when a small group or missing data makes a pattern uncertain.
- Write findings separately from possible explanations. Include the checked numbers, their scope, and the questions you would investigate next before changing an operational process.
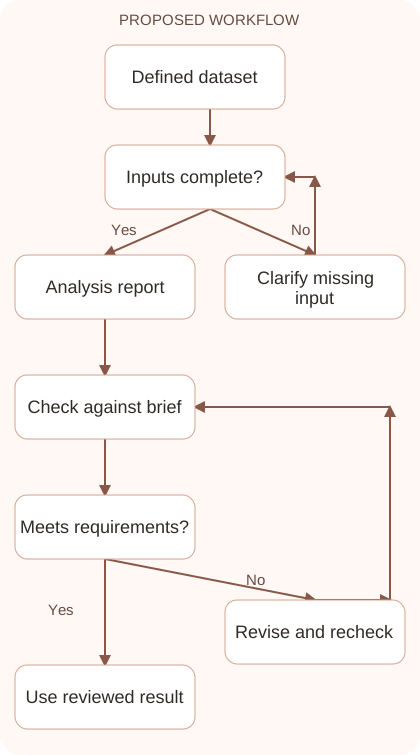
Workflow graph
Reusable prompt
Analyze this synthetic project table to compare elapsed calendar days by project type. First inspect data quality and propose cleaning rules. Show reproducible calculations, summarize group sizes, and suggest an appropriate chart. Separate observed differences from possible causes. Do not invent missing values or imply causation.Replace the bracketed fields with approved information. Keep the prompt as a draft template: the person responsible for the work must still check its output before using it.
Quality checks and troubleshooting
- Metric definitions and exclusions are explicit.
- Sample calculations agree with independent checks.
- Charts and conclusions describe the same dataset and units.
Keep group sizes beside averages so a category containing one project is not presented as equally representative as a larger group. Save field definitions, cleaning decisions, calculations, and dataset version. Show how same-day completion and missing delivery dates are treated. If correcting one record changes a chart substantially, explain that sensitivity before recommending a process change. Transparent analysis helps readers understand where collecting better data would contribute more than adding another visually impressive but weakly supported graph.
| Stage | What to prepare | What to verify |
|---|---|---|
| Input | Approved information and a defined question | Relevant evidence or a reproducible example |
| Draft | A result that follows the requested format | No hidden assumptions or unsupported promises |
| Review | A check against the brief and original material | Correct facts, behavior, and important conditions |
| Handoff | A usable result with remaining limits stated | The next person knows what was checked |
Practice and improve the workflow
Run a small practice cycle before expanding this workflow. Choose an input whose correct result you already understand, complete the task once, and compare the output with your own independent check. Record the prompt, the source or example, the mistake you found, and the correction you accepted. Change only one important variable on the next attempt so you can see whether the improvement came from clearer context, a better instruction, or a more useful review step.
Keep a reviewed example as your baseline. When the task, source material, or tool changes, repeat the checks most likely to be affected. If a recurring defect appears, revise the process instead of patching the final wording every time. Save the useful structure while removing previous client details and obsolete assumptions. This habit makes the workflow easier to maintain and easier to explain to a teammate who did not see the original conversation.
Download the plain-text prompt and review checklist for your own practice notes.
10 frequently asked questions
Can Claude analyze a dataset?
It can help plan and explain analysis. Use available tools for reproducible calculations and verify important results against the source data before acting on them.
What should I define before analysis?
Specify the question, population, time range, metric, units, and treatment of incomplete records. These choices determine what a result actually means.
How do I handle missing values?
Record where they occur and decide whether exclusion or another justified treatment is appropriate. Do not silently invent values merely to complete a chart.
Should I trust calculated totals?
Check representative rows and aggregate results independently. Numerical output needs verification, especially when data cleaning or grouping changes the denominator.
What chart should I request?
Choose according to the question: comparisons, distributions, relationships, and trends need different visual forms. Ask for clear labels and a reason for the choice.
Can a chart prove the cause of a delay?
An observed association does not establish cause. Consider scope differences, selection effects, and missing variables before making a causal explanation.
Should I remove outliers automatically?
Inspect them first. An unusual value may be a data error or a genuine event; removal needs a documented reason consistent with the analytical question.
How do I protect client data?
Use synthetic or appropriately anonymized examples and follow your organization’s rules. Share only the fields necessary for the analysis task.
What belongs in the final report?
Include the question, definitions, checked findings, chart explanations, limitations, and next questions. Avoid conclusions broader than the dataset supports.
How can I repeat the analysis next month?
Save the cleaning rules, calculations, and report structure. Validate new data against the same definitions so comparisons do not reflect unnoticed methodological changes.
Resources and related guides
Official documentation supports current product details; the worked examples, diagrams, and review routines on this page are editorial recommendations. Check relevant account settings and organizational rules before using a feature with real work.
- Anthropic prompting guidance
- Anthropic guidance on reducing hallucinations
- Official Claude file upload guide
Continue with the Claude for Excel: Explain and Check Spreadsheet Formulas to develop a related skill, or use the Claude for Research: Verify Sources and Build Evidence for the next practical task. For another assistant’s approach, compare the related ChatGPT or AI workflow guide.